

A client-side circuit breaker exists to protect a struggling service while it recovers. It is easy to treat it as self-contained: set a failure threshold, set a probe window, and trust it to close once the service is well again. Put one in front of a service that scales itself, and it can do the opposite. The breaker stays open for hours against a service whose dashboards show nothing wrong.
The cause is rarely a fault in either component. It is the two of them responding correctly to each other. The breaker withholds traffic, so the autoscaler removes capacity, so the breaker’s probes are answered by a fleet sized for a trickle, so closing the breaker releases full load onto it. That is a loop, and no amount of breaker tuning breaks it on its own.
Zalando published a careful account of exactly this failure in October 2026, traced request by request. This article takes their reasoning and turns it into the checks and settings to apply to an estate of ordinary size.
How the trap is set
The order of events matters, so it is worth walking through.
Something pushes the service into slow responses. In Zalando’s case it was a scheduled batch client landing on top of customer traffic. The client’s breaker sees timeouts and opens. That part is working as designed.
With most traffic withheld, the service now looks idle. The Horizontal Pod Autoscaler does what it should with an idle service and scales it down. Its default scale-down behaviour waits through a five-minute stabilisation window and then allows every replica above the floor to be removed at once, so a breaker that stays open for more than a few minutes leaves the service at its minimum replica count.
The breaker moves to half-open and lets a few probe requests through. The small fleet answers them quickly, because a few requests are easy work for any number of pods. The probes meet the success criteria, and the breaker closes.
A half-open probe tests the service as it is, not as it will be once the breaker closes.
Now everything the client was holding back arrives together. The minimum fleet cannot absorb it. Requests queue in front of the pods, wait past the client’s timeout, and fail. The breaker sees a wall of timeouts and opens again. Zalando measured the whole cycle, from probes succeeding to the breaker reopening, at about three seconds.
- Scale-down
- after a five-minute window, by default
- Cycle
- about three seconds, probe to reopen
- Breaks it
- capacity in place before full load returns
This diagram as text
- Breaker opens — on timeouts
- Autoscaler scales down — to minimum replicas
- Half-open probes — a few requests, answered fast
- Queues and timeouts — past the client deadline
- Withheld load arrives — all at once, on the minimum fleet
- Breaker closes — looks like recovery
Relationships
- Breaker opens → Autoscaler scales down — idle
- Autoscaler scales down → Half-open probes
- Half-open probes → Breaker closes — pass
- Breaker closes → Withheld load arrives
- Withheld load arrives → Queues and timeouts
- Queues and timeouts → Breaker opens — reopen
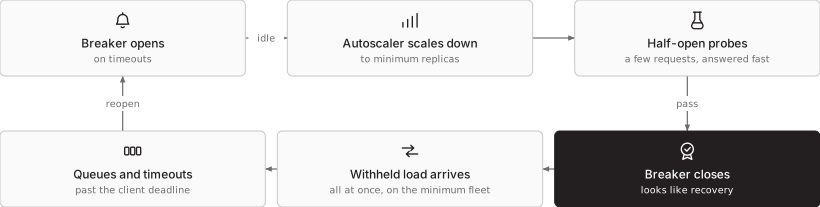
Each component behaved correctly by its own definition. The breaker opened on failures and closed on successes. The autoscaler shrank an idle service. The defect lives in the assumption the breaker makes about its environment: that the service it probes is the service that will receive the traffic.
Why the autoscaler cannot rescue it
The obvious objection is that the autoscaler should see the burst and add pods. It cannot, because the burst is shorter than the loop that would respond to it.
The Kubernetes controller samples metrics every fifteen seconds by default. Scale-up has no stabilisation window, but it is still limited to doubling the replicas or adding four pods every fifteen seconds, whichever is more, and each new pod has to start and pass its readiness check before it takes traffic. A spike lasting a few seconds is over before any of that begins. Averaged across a minute, the CPU of a fleet that was overwhelmed for three seconds and idle for the rest looks like a small blip.
Scaling on CPU makes this worse. CPU is a late and noisy proxy for load, a point made at more length in autoscaling that actually reduces the bill. Here it is also the wrong shape of signal: the overload shows up first as requests waiting in a queue, and the pods doing the work may be barely busy while it happens.
Zalando’s two manual fixes confirm the mechanism. Forcing the breaker closed sent sustained traffic, which the autoscaler could see and respond to. Scaling the service out by hand let the next natural close succeed. Both worked because they put capacity in place before full load arrived.
Why the dashboards did not show it
At a few requests per second per pod, aggregate percentiles stop describing the system. Individual slow requests dominate them, and a request-rate graph shows an erratic line without showing why.
A standard trace view shows one request at a time, which is the wrong scale for a failure that is a pattern across hundreds of requests in a few seconds. Zalando found it by exporting raw OpenTelemetry spans and plotting many traces together, with time on one axis and requests in order on the other. The probe phase, the close, the queue forming and the reopening then appear as one shape.
The lesson for a smaller estate is modest and practical. Keep traces for long enough that you can pull a ten-minute window after the fact, with span start times and durations intact. If the collector samples by tail, keeping every error and slow request, keep a baseline of ordinary traffic as well. The avalanche will be retained either way; the fast probes that explain it are the part a pure errors-and-slow policy throws away.
Breaking the loop
There are several places to intervene. Most estates want two or three of them together, chosen by what each one costs.
| Change | Where | What it does | What you accept |
|---|---|---|---|
| Set the replica floor for released load | Autoscaler | The fleet never shrinks below what the withheld traffic needs when it returns | Paying for capacity that is idle while the breaker is open |
| Lengthen scale-down stabilisation | Autoscaler | Short breaker-open periods no longer remove capacity | No help when the breaker stays open longer than the window |
| Scale on concurrency or queue depth | Autoscaler | Overload is seen as waiting work, not as a CPU average | A custom or external metrics pipeline to run and trust |
| Ramp traffic on close | Client | Load returns in steps the fleet can absorb and react to | Library support, or a longer and heavier half-open phase |
| Shed load and propagate cancellation | Service | Queues stay short, and work for requests the client abandoned stops | Explicit rejections the client has to handle |
The replica floor is the most direct fix and the one most often set by accident. A minimum chosen to save money on a quiet night is also the capacity the service will meet the next traffic release with. Set it from the load the breaker can release, not from the quietest hour. That is not the reserved-and-unused waste that inflates cloud bills, provided it is set deliberately and measured, because it is capacity with a stated job.
Ramping on close follows advice the Google SRE book gives for any recovering cluster: when adding load, increase it slowly. If your breaker library supports a graded return of traffic, use it. If it does not, a longer half-open phase that admits more probe traffic gives the autoscaler something real to see before the breaker commits.
Shedding load at the service boundary keeps the queue from running away. A service that rejects new work early, with a clear overload response, recovers faster than one that accepts everything and answers it late. Zalando also found their service still working on requests after the client had timed out and dropped them. That work has no value to anyone, and propagating the client’s deadline or cancellation so the service stops on it removes load at exactly the moment there is most of it.
Test it before a morning peak does
This failure is cheap to reproduce in a pre-production environment and expensive to meet in production. Hold the breaker open, or make the service slow enough to open it, and wait until the autoscaler has taken the service to its minimum. Then let the breaker close on its own and watch whether it stays closed.
If it reopens, you have the loop. If it stays closed, record the replica floor, the scale-down window and the probe settings that made it work, because a later change to any one of them can bring the loop back without anyone noticing.
How STP approaches this
When we review a platform with circuit breakers in front of autoscaled services, we read the breaker settings and the autoscaler settings together, because they are one control loop and are often owned by different teams. We look first at the replica floor and the scaling metric, then run the open, scale down, close sequence in pre-production before recommending any change to thresholds.
More on Kubernetes platforms and managed IT and monitoring, or start a conversation.