

Most observability spend buys storage rather than answers. A team adds a vendor agent, turns everything on, and two years later has a large bill, dashboards nobody opens, and still cannot say why last Tuesday was slow.
The fix is structural, and it is mostly about where the decision points are.
Instrument once, decide the backend later
The expensive mistake is putting a vendor’s SDK into every service. The instrumentation then belongs to that vendor, and changing backend means touching every repository in the estate.
OpenTelemetry inverts this. Applications emit traces, metrics and logs through a neutral SDK to a collector. The collector decides where data goes — and that is the only place that has to change.
- Changing backend
- a collector configuration change
- Redaction
- in the collector, before egress
- Sampling
- tail-based, after the trace completes
- Migration
- dual-ship, compare, then cut over
This diagram as text
- Emitted over OTLP
- Traces
- Metrics
- Logs
- Host and infrastructure
- OpenTelemetry Collector — filter · redact · tail-sample · route — the only place that changes when the backend does
- Backends one, or two during a migration
- Grafana, Loki, Prometheus — self-hosted
- Datadog — managed
- Elastic — log search at depth
- CloudWatch — already there
Relationships
- Traces → OpenTelemetry Collector
- Metrics → OpenTelemetry Collector
- Logs → OpenTelemetry Collector
- Host and infrastructure → OpenTelemetry Collector
- OpenTelemetry Collector → Grafana, Loki, Prometheus
- OpenTelemetry Collector → Datadog
- OpenTelemetry Collector → Elastic
- OpenTelemetry Collector → CloudWatch
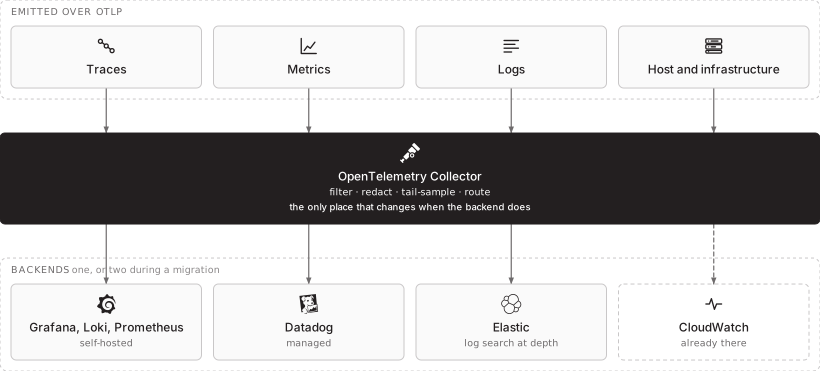
The collector earns its place for three things beyond routing:
- Redaction before egress. Tokens, authorisation headers and personal data get stripped at the collector rather than hoped about in application code. In a hosted backend this is the control that makes the arrangement lawful.
- Tail-based sampling. Decide what to keep after the trace finishes, so every error and every slow request is retained while routine successful traffic is sampled down. Head-based sampling throws away the interesting traces at random, which is the opposite of what you want.
- Dual-shipping during a migration. Send to both the old and the new backend, compare, then cut over. Without this, backend changes are a leap.
What each backend is actually good at
| Backend | Strongest at | The trade |
|---|---|---|
| Grafana + Loki + Prometheus | Cost at volume; one query surface over metrics, logs and traces; self-hostable anywhere | You operate it, including its own storage and availability |
| Datadog | Breadth and correlation out of the box, mature alerting, low staff cost | Highest cost per gigabyte; cost control is an ongoing discipline |
| SigNoz | OpenTelemetry-native, traces and metrics in one place, self-hosted | Smaller ecosystem; fewer integrations to lean on |
| Elastic / ELK | Log search and analytics at depth, long retention, flexible queries | Cluster operations are a real job; sizing mistakes are expensive |
| CloudWatch | Already there for AWS resources, no agent for most services | Weak cross-service correlation; costly for high-volume custom logs |
| OneUptime / status tooling | External availability checks and the public status page | Tells you that it is down, not why |
A single backend for everything is rarely the cheapest answer. A common and sensible split: self-hosted Loki for high-volume application logs where the per-gigabyte cost dominates, a managed platform for traces and alerting where availability during an incident matters most, and external uptime checking from outside your own network so that an estate-wide failure still produces an alert.
That last point gets missed routinely. Monitoring that runs entirely inside the environment it watches goes silent at exactly the moment it is needed.
The four signals worth alerting on
Dashboards are for investigation. Alerts are for waking someone, and most estates have far too many.
Alert on symptoms the user experiences, not on causes:
- Latency, at a percentile rather than a mean. A mean response time hides the tail that users actually complain about.
- Error rate, as a proportion of traffic, so it stays meaningful as volume changes.
- Saturation — the resource closest to exhaustion. Usually memory, disk or connection pool, rarely CPU.
- Traffic, mainly so the other three can be interpreted.
Everything else belongs on a dashboard. An alert that nobody acts on trains people to ignore the channel, which is how the real one gets missed.
What actually drives the cost
Two things, in this order:
- Log volume. Debug logging left enabled in production typically produces most of the bill. The fix is a log level that is a deployment decision rather than a code constant, so verbosity can be raised for an investigation and lowered again.
- Cardinality. A user id, a request id or a full URL path used as a metric label multiplies time series without bound. This is the failure that takes a metrics backend down, and it is written in the application, which is why the cost conversation has to include the people writing it.
Retention is the lever most teams reach for first and should reach for last. Thirty to ninety days hot and searchable covers nearly all operational need; the longer regulatory obligation is better served by a cheap cold archive than by keeping a year of logs in an expensive index.
It is also the compliance evidence
ISO/IEC 27001 Annex A 8.15 and 8.16 ask for logging and monitoring that demonstrably happened. An estate built this way answers that without a separate exercise: the collector configuration shows what is collected and what is redacted, retention is a stated and enforced setting, and alert history shows monitoring was operating over time rather than at the moment of the audit.
The control an auditor probes hardest is whether an administrator can delete their own activity logs. Shipping to a backend the administrator does not control, with retention they cannot shorten, is the answer — and it is an architectural decision, not a policy one.
How STP approaches this
We instrument with OpenTelemetry so the backend stays a decision rather than a commitment, put redaction and sampling in the collector, split high-volume logs from traces and alerting where the economics justify it, and check availability from outside the estate. Where a stack already exists, we start by finding what the bill is actually made of, which is almost always debug logging and a handful of high-cardinality labels.
More on managed IT and monitoring, DevOps and platform automation and audit and compliance, or start a conversation.